The Slow MachineDraining the Ocean
On Monday the eighteenth of November, 1929, in telegraph offices on both sides of the Atlantic, the lines began to go dead.
Just after five that afternoon, an earthquake had struck under the continental slope south of Newfoundland, in an area of fishing grounds called the Grand Banks.
Onshore, it sent a tsunami into the Burin Peninsula of Newfoundland and killed twenty-eight people. Offshore, it did something stranger.
Running across that stretch of sea floor were transatlantic telegraph cables — the nerves of the North Atlantic, that carried every message between Europe and North America. Twelve of them broke.
They did not break all at once. That is the part that made no sense.
The cables nearest the epicentre went instantly. Then the next ones out. Then the next. The breaks marched steadily away from the quake and down the slope into deep water, and they took thirteen hours to get to the far end. We know because the companies wrote it down: when a line went dead, the operator noted the minute.
So there was a record. An accidental stopwatch, laid across the sea floor, timing something as it went past.
Something had come down that slope. Something enormous, moving fast, snapping armoured steel cable as it went — and at the near end it had been moving at fifty or sixty miles an hour.
Nobody knew what. Nobody could even guess, and for twenty-three years nobody did.
That is how well we knew the bottom of the ocean in 1929. Two thirds of the surface of this planet, and a process could come tearing across it at the speed of a train, destroy twelve pieces of critical infrastructure, leave a timed record of itself, and remain completely unexplained. Nobody imagined anything down there could move.
There was no picture of the sea floor at all.
This is The Slow Machine. Episode six: draining the ocean.
§ I
The Largest Blank
We left Arthur Holmes with the right answer and no way to test it: heat from the Earth's own radioactivity, turning the mantle over like water in a kettle, too slowly to see. His convection currents rise and split the floor apart, and sink and drag the floor back down, and every last bit of that happens out of sight under an average of three and a half kilometres of water.
So: how do you find out what is down there?
Until the 1920s, there was exactly one method, and it had not changed in principle since antiquity. You stop the ship. You put a weight on the end of a very long wire. You let it out until it goes slack, and you write down how much wire you used. Then you wind it all back in.
A single sounding in deep water took several hours.
The heroic version of this was the voyage of HMS Challenger, which spent three and a half years in the 1870s circumnavigating the globe for science, and took something under five hundred deep soundings in the whole time.
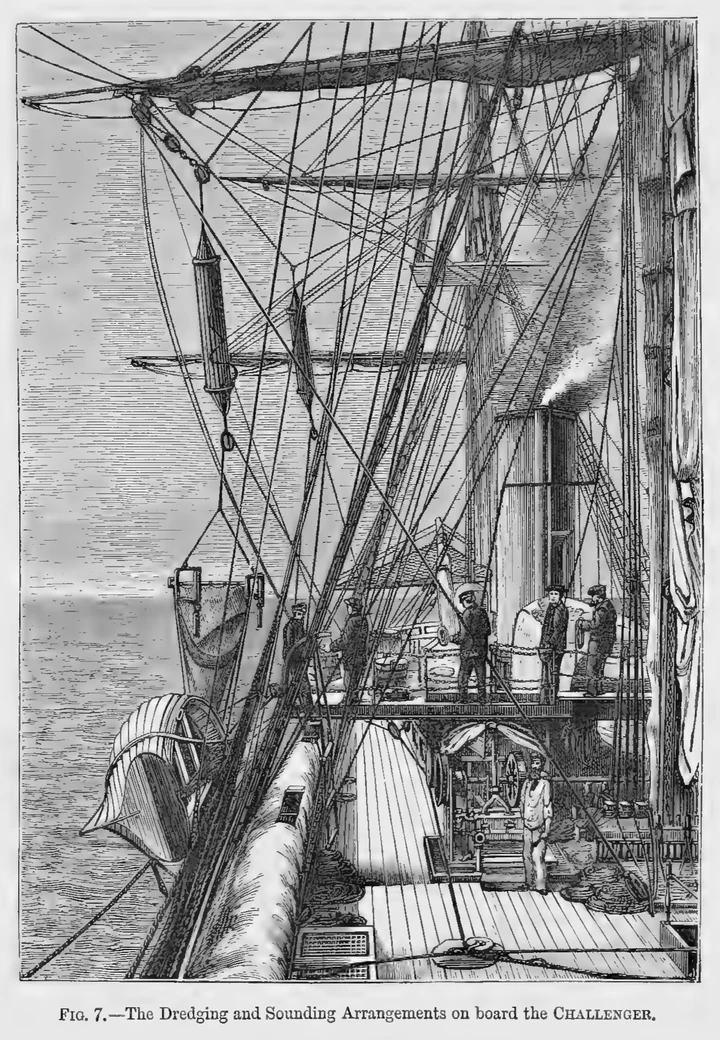
Five hundred points. For an area of a hundred and forty million square miles.
Imagine trying to describe the surface of Africa from five hundred pinpricks, taken at random, in the dark, by a man lowering a weight on a string out of a balloon. You would get the general idea that there is a continent. You would not get the Rift Valley.
So people filled in the blank with an assumption, and the assumption was perfectly reasonable.
On land, rain and rivers and frost carve the ground into shapes. At the bottom of the sea there is no rain, no river, no frost.
The deep sea floor, everyone agreed, would be flat. It is the lowest place on Earth; everything that falls into the ocean eventually lands there; nothing disturbs it. Dust from the continents, shells from the surface, volcanic ash, meteorite fragments — all of it drifting down, forever, onto the bottom of a still, cold, dark room.
The sea floor was the planet's basement. The oldest, dullest, most undisturbed surface in the world, buried under the accumulated sediment of every era since the beginning.
That was the picture. Every word of it turned out to be wrong.
§ II
The Ping
The invention that broke the sounding wire's monopoly was, once again, not built for geologists.
It was built because ships kept hitting things.
After the Titanic, there was serious money for any device that could detect an iceberg before it arrived, and the idea people converged on was sound. Fire a pulse into the water, listen for the echo, time the gap. Sound travels through sea water at about fifteen hundred metres a second, near enough, and it is a very stable number. Halve the time, multiply by the speed, and you have a distance.
Point it forward and it tells you about icebergs. Point it down, and it tells you the depth of the water, instantly, without stopping the ship.
And then the First World War erupted, and the submarine turned out to be the most frightening weapon at sea. The sensible version of the iceberg problem became a military one: find the metal hull hiding in the water and kill it before it kills you.
That is where the money went, in both wars. Listening to the sea. Building better transmitters, better receivers, better timing.
The by-product was that a ship fitted with an echo sounder draws a line of the sea bottom as it steams — continuously, for free, while going about its business. Not five hundred points in three years. A depth every few seconds, for as long as the ship is running.
The instrument was called an echo sounder, and the wartime family of techniques it belonged to acquired an acronym from sound navigation and ranging. Sonar.
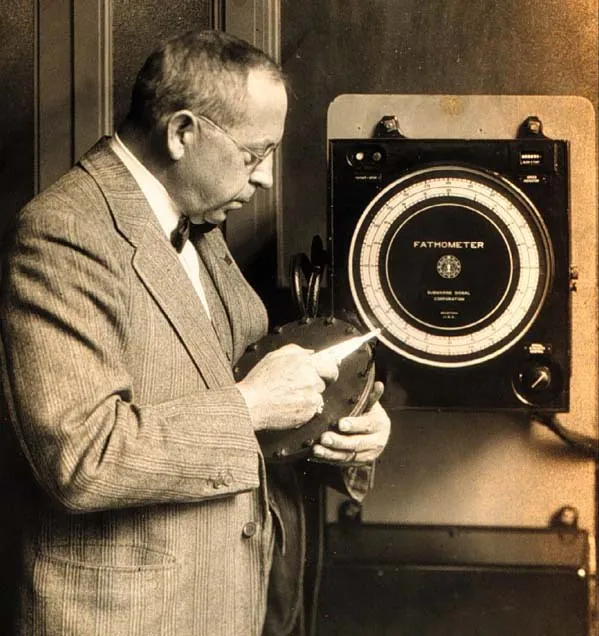
Here is my favourite and most creative use of one.
In 1941, a Princeton geology professor called Harry Hess was commissioned into the United States Navy, and in time was given command of a ship — the Cape Johnson, an attack transport, whose job was to carry troops to landings in the Pacific.
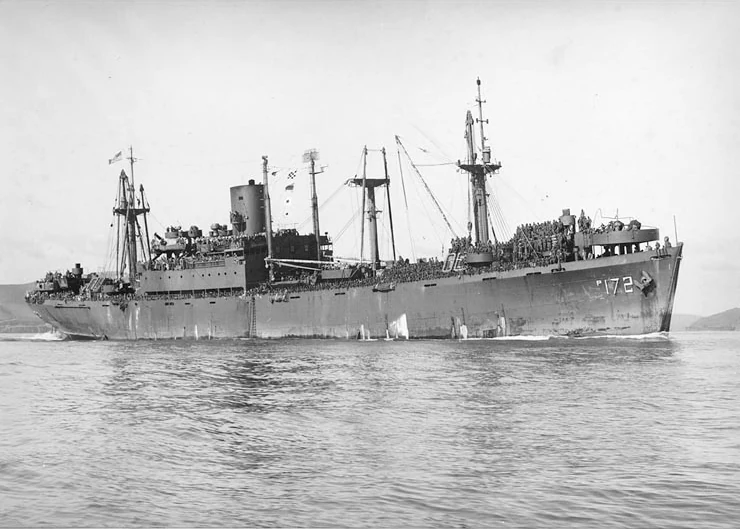

The Cape Johnson had a modern echo sounder, for finding submarines and for not running aground on somebody's reef. And Harry Hess simply never turned it off.
Not on passage. Not on station. Not between the Marianas and the Philippines and Iwo Jima. Wherever the war sent him, the sounder ran, and the paper came off the drum, and a geologist in a naval officer's uniform collected it.
By 1945 he had thousands of miles of profile across the North Pacific that nobody had asked for, and in it, something new: dozens of undersea mountains with their tops cut off, as if somebody had shaved them flat. He named them guyots, after a nineteenth-century geographer, and they bothered him for the next fifteen years, because a flat top means a mountain that once stood at the surface and was worn down by the waves — and these were a mile and more underwater.
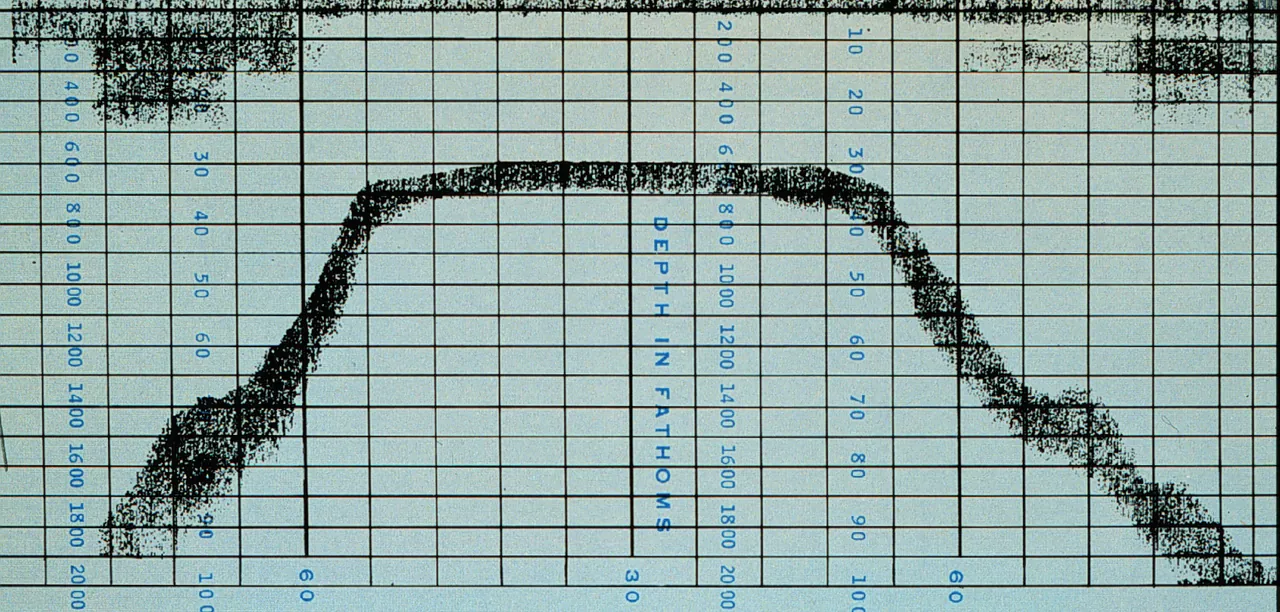

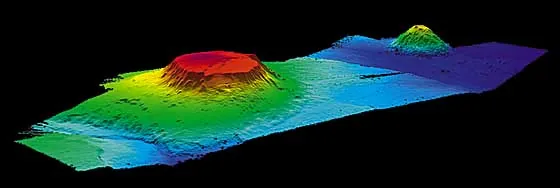

Remember Harry Hess. He works out what they mean in Episode 7.
§ III
The Surplus
1945. The end of the Second World War leaves behind an extraordinary situation.
In America above all, there is a surplus of instruments: echo sounders, hydrophones, magnetometers, all of it built to hunt submarines, all of it suddenly going cheap.
There is also a surplus of people: a generation of physicists, engineers and electronics men who had spent six years being extremely clever about the sea, now demobilised and looking for something to be clever about.
And, most importantly, the navies do not stop paying. The Cold War starts almost at once, submarines will soon carry the bomb, and a navy that wants to hide its own submarines and find the other side's has a permanent, expensive, urgent need to know the ocean: its shape, how sound travels through it, and its magnetism — because a steel hull makes a tiny dent in the Earth's magnetic field, and you can only spot the dent if you know the field.
Oceanography, which had been a poor relation among the sciences, becomes strategic. The money serves the Navy's purposes. The scientists take it and ask their own questions.
In 1949, Columbia University set up a geological observatory on a country estate at Palisades, New York, overlooking the Hudson. It was called Lamont, and its director was a Texan named Maurice Ewing, who had one governing conviction: that you learn about the world by going out and measuring it, in quantity, without waiting to know why.
Lamont gave the echo sounder a far better recorder — the precision depth recorder, which sharpened its output from a rough trace to a genuinely accurate profile. Ewing acquired a ship, the Vema, a three-masted schooner with a past as a rich man's yacht.
And he instituted a rule so simple it is almost comic. Any Lamont ship, anywhere in the world, for any reason, runs the depth recorder the entire time it is at sea and takes at least one core of the bottom every single day.
Not because there was a hypothesis. Because the data did not exist and somebody had to go and get it.
§ IV
Three Things That Were Wrong
Within a few years the cores and the profiles started saying things nobody had ordered.
The first: the mud was far too thin.
If sediment has been settling onto the deep ocean floor ever since the Earth had oceans — and according to the old picture it has, for billions of years, undisturbed — then the layer should be kilometres deep. Miles of the stuff. Instead the seismic measurements kept coming back with a thin skin over hard rock. In places, barely anything.
Either it had only recently started raining down, or the floor it was landing on had not been there very long.
The second: nobody could find an old rock.
On land, this is not hard. Geologists routinely handle continental rock hundreds of millions of years old, and in the shield areas of Canada and Africa and Australia, billions of years.
From the deep ocean floor — dredged, cored, hauled up from anywhere — nothing older than about two hundred million years ever came up. Not rarely. Never.
Two hundred million years is a long time to a person. To a planet that is at minimum three billion years old, it is the last few per cent. The ocean floor, supposedly the oldest surface on Earth, was turning out to be the youngest thing on it.
And the third: the heat was in the wrong place.
You can measure how much heat is leaking out of the sea bed by pushing a probe into the mud and reading the temperature at two depths. Tedious, but simple. And when they did it in quantity, the answer was not uniform. Along the crests of the undersea mountain ranges, the heat pouring out was several times higher than the ordinary sea floor.
Something down there was hot, and it ran in a line along the crests of the mountains.
Three facts. Thin sediment, young rock, hot ridges. Any one of them is an anomaly. Together they are an accusation, and what they are accusing the sea floor of is being new.
But none of that is a picture of the ocean floor. To get a picture, somebody had to sit down and draw it — and the person who did it was not allowed on the ships.
§ V
The Woman at the Drafting Table
Marie Tharp was born in Michigan in 1920, the daughter of a soil surveyor for the Department of Agriculture, which meant a childhood of moving house constantly and of watching a parent make maps of the ground.
She did not set out to be a geologist. Geology was not, in 1940, a thing that welcomed women. What changed it was the war: with the young men gone, the University of Michigan opened its petroleum geology programme to women, on the frank basis that the oil industry needed bodies. She took the degree, worked for an oil company in Tulsa, added a second degree in mathematics because she was bored, and in 1948 turned up at Columbia looking for work.
She was hired as a draughtsman. Which is to say: the ships would go out, the numbers would come back, and Marie Tharp would turn columns of depths into pictures.
Understand what that job actually is, because it is not clerical.
A precision depth recorder gives you a long roll of paper with a wiggly line on it. That line is a vertical slice through the ocean along the track the ship happened to take. To turn it into anything you have to correct it for the speed of sound in that particular water, and plot it against the ship's position, which in the 1950s means celestial navigation and dead reckoning, and then you have one profile — one cut across the Atlantic.
Then you do another. And another. And you lay them side by side, in the right relative positions, and you start to ask what shape would produce all of them at once.
That is not drawing. That is the reconstruction of a three-dimensional object from a handful of one-dimensional slices, in your head, with a pencil — of a thing nobody had ever seen, so there was nothing to check it against.
She was also not permitted to go and see the thing she was mapping. Ewing did not allow women on the Lamont ships — women aboard were held to be bad luck. Marie Tharp did not get to sea until 1965, seventeen years in.
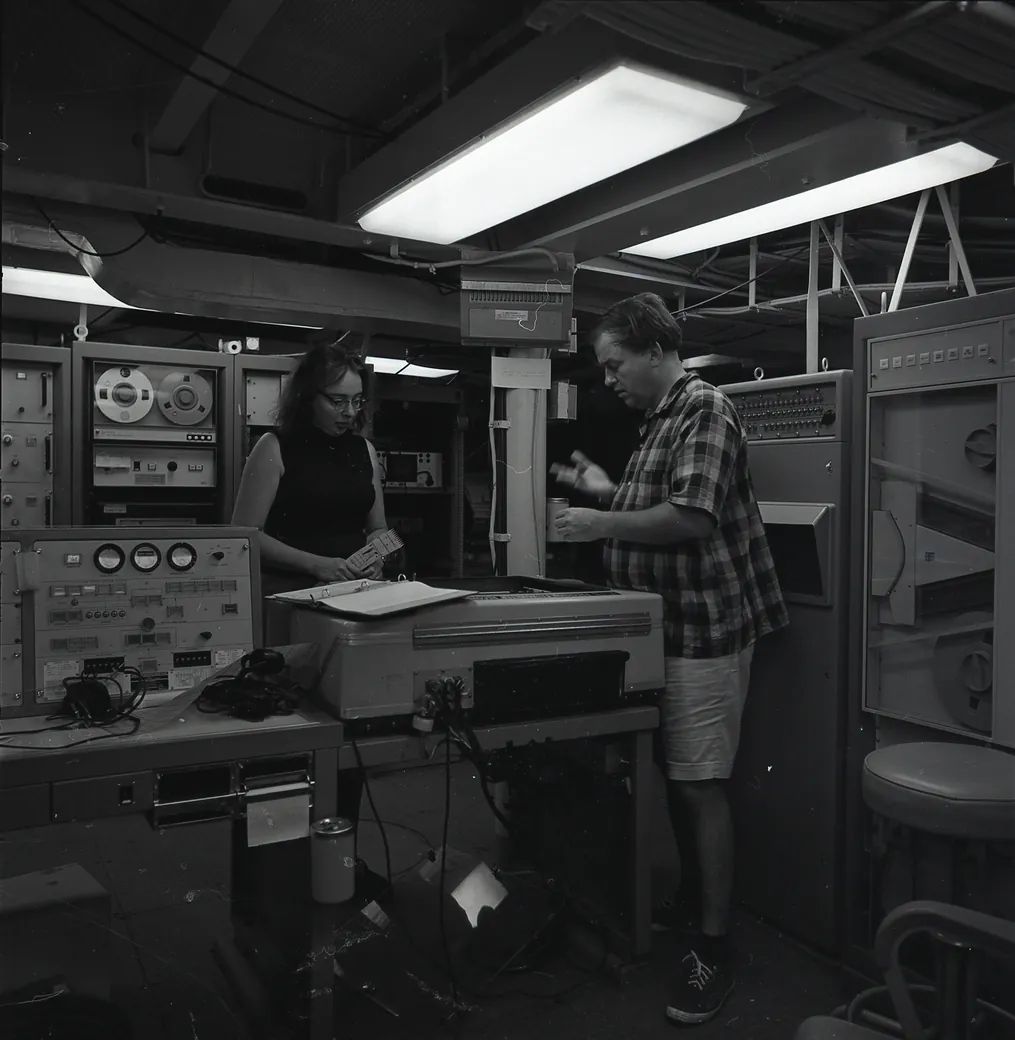
In 1952 she had six profiles across the North Atlantic laid out in front of her.
Every one of them showed the mid-ocean mountain range, which was not news — the existence of high ground in the middle of the Atlantic had been suspected since the 1850s, when the men surveying a route for the first telegraph cable found the bottom coming up to meet them where it had no business to.
But at the very crest of that range, on every single profile, there was a notch.
Not a valley between two peaks. A cleft. A deep, steep-sided gash running along the top of the ridge itself — right where the highest ground should be.
She knew exactly what that shape was. She had seen it on land. A valley formed at the top of an arch, where the ground is being pulled apart and the middle drops in. A rift.
Here is her own account of what happened when she showed her colleague Bruce Heezen.
Marie Tharp1When I showed what I found to Bruce, he groaned and said, "It cannot be. It looks too much like continental drift."
1 · VerbatimMarie Tharp, "Connect the Dots: Mapping the Seafloor and Discovering the Mid-ocean Ridge" (1999), ch. 2 of Lamont-Doherty Earth Observatory of Columbia: Twelve Perspectives on the First Fifty Years, 1949–1999, ed. Laurence Lippsett; widely reprinted
He dismissed it, in her recollection, as girl talk.
Why drift? Because a crack down the middle of an ocean is what you would expect if the two sides were being pulled apart, with new floor welling up between them. Holmes had drawn exactly that in 1931.
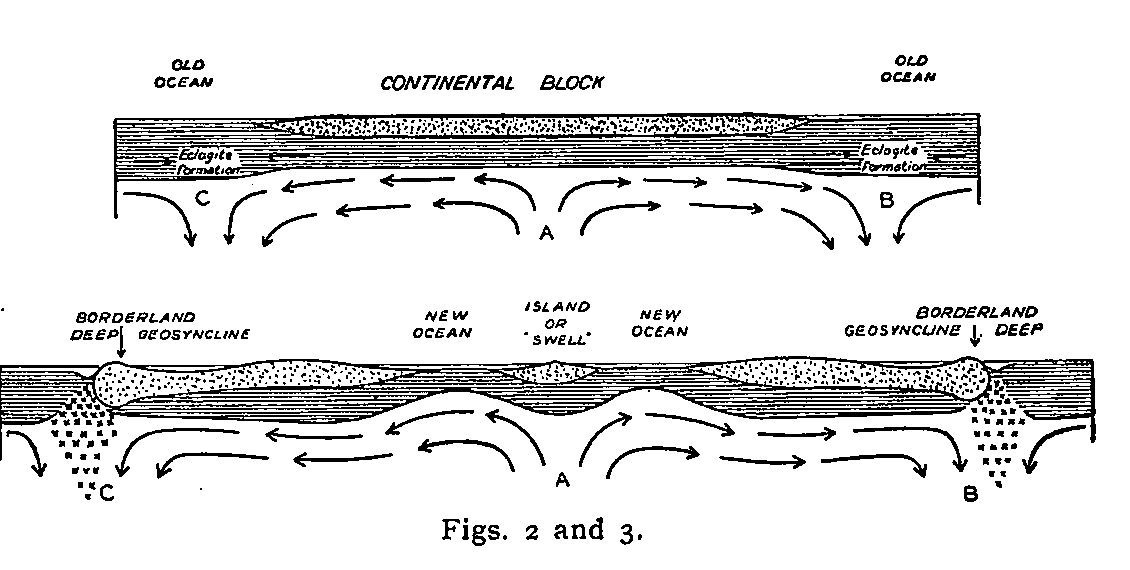
I want to be careful here, because it would be easy and wrong to make Heezen the villain of this episode. He came round, he became her lifelong collaborator, and the maps they made together carry both their names.
But look at the sentence. It looks too much like continental drift.
That is not a scientific objection. He is not saying the data are bad, or the profiles are misplotted, or there is a simpler explanation. He is saying: this resembles a discredited idea, therefore it is embarrassing, therefore no.
Thirty years after the New York meeting where Wegener was taken apart, the taboo is still doing active work. It is stopping a man from believing a measurement that is sitting on the desk in front of him.
He made her do the profiles again. She got the same answer. Hooke would have recognised her: she believed the evidence over the expectation.
§ VI
The Overlay
And then the proof that the rift was real arrives sideways, from the telephone company.
Remember the twelve cables that snapped off Newfoundland in 1929, and the thirteen hours between the first break and the last.
In 1952 — the same year Marie Tharp was laying out her profiles a few rooms away — Bruce Heezen and Maurice Ewing worked out what had done it.
The earthquake had shaken an enormous mass of loose sediment off the top of the continental slope, and it had gone down the slope as a slurry: mud and sand mixed into the water, heavier than the clear water around it, and therefore running downhill exactly the way water runs downhill. It picked up speed. It picked up more sediment, which made it heavier, which made it faster. A landslide behaving like a flood, three hundred miles long, in the dark.
They called it a turbidity current. It was the same slide that had sent the wave into the Burin Peninsula. And the only reason anybody knows how fast one travels is that this one happened to run across twelve clocks.
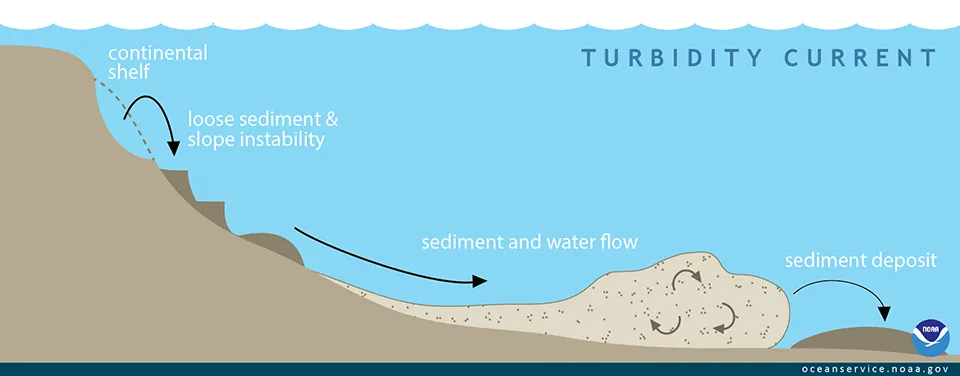

Which tells you the other thing about the sea floor that nobody had allowed for. It is not a still basement where dust settles. Things fall down it. Things race across it. It has weather.
And transatlantic cables were still breaking, and they were still ruinously expensive, and the people who owned them wanted to know where it was safe to lay the next one. So Bell Telephone Laboratories paid Lamont to find out.
Part of that work — done by Heezen with an assistant named Howard Foster — was to plot every earthquake epicentre known in the Atlantic onto a map, at the same scale as everything else, because you do not want to lay a cable across a place where the sea floor keeps moving.
It was housekeeping. It was a contractor's deliverable for a utility company.
Then Heezen laid the earthquake map over Tharp's map of the ridge.
The epicentres lined up along the rift. Not just somewhere on the range, which seismologists had noticed before. Along the cleft itself: a thin seam of earthquakes running down the centre of the mountains.
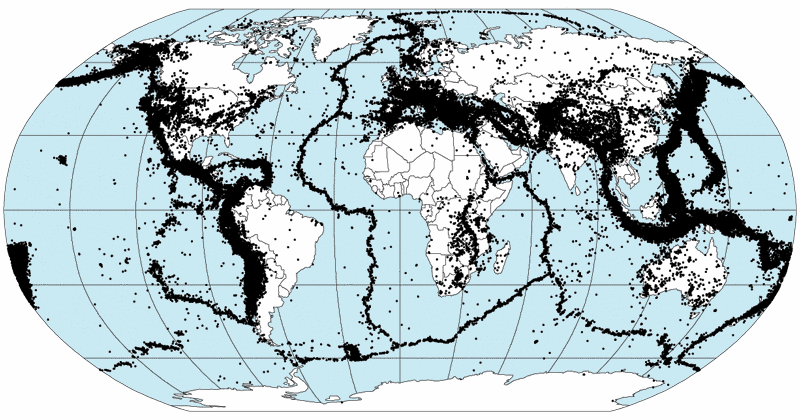

Two datasets that had nothing to do with each other. One from the Navy's echo sounders, one from a telephone company's insurance problem. Neither collected to test anything. And they agree.
That is when the notch stops being a drawing and becomes a fact, because there is now a second, independent instrument pointing at it. The rift is where the earthquakes are. The middle of the ocean is cracked, and it is moving.
Heezen stopped arguing. I'm guessing that Tharp smiled.
§ VII
The Seam
Now they went looking for the end of the rift.
They had the North Atlantic. The ridge ran on south, so they followed it south — down past the equator, down the length of the South Atlantic, with the rift valley still sitting in the crest of it the whole way.
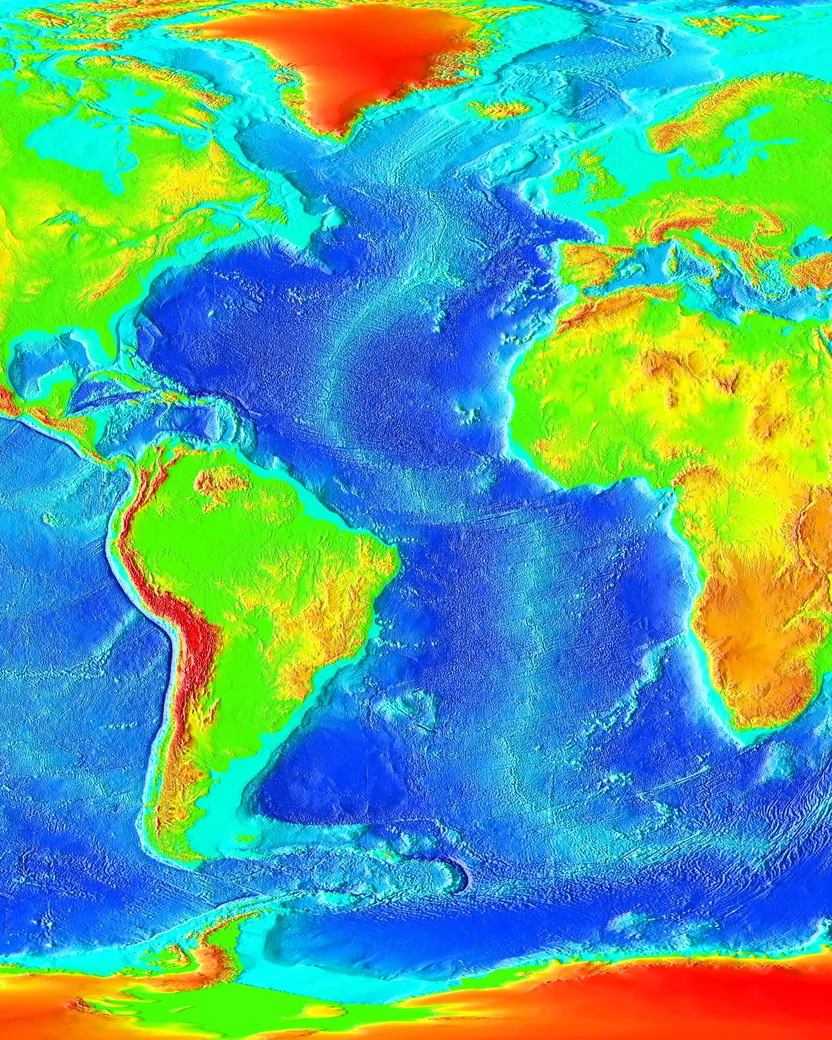

It went round the bottom of Africa. It carried on into the Indian Ocean, where it forked. One branch ran up into the Gulf of Aden and the Red Sea, which are themselves, unmistakably, a continent in the early stages of being torn open. The other went east and south, under the Southern Ocean, right round beneath Australia and New Zealand, and up the eastern Pacific towards California, where — and this took some swallowing — it appears to run underneath North America.
It does not end.
The mid-ocean ridge is a single connected mountain system roughly forty thousand miles long. It runs through every ocean basin on Earth. It is, by an enormous margin, the largest landform on this planet — longer than the Andes, Rockies, Alps and Himalayas put together, several times over — and it is on average two to three kilometres high, and it is everywhere, and until the middle of the twentieth century nobody had the faintest idea it was there.
Here is the picture to hold on to.
Look at a baseball, a tennis ball or a cricket ball. It has a seam: a single continuous curving line that wanders over the whole surface and closes on itself, dividing the ball into pieces.
The Earth has one of those. And along the entire length of it, the seam is split open, the ground is hot, and it shakes.
Tharp and Heezen published the North Atlantic sheet in 1957 and spent the next twenty years extending it, ocean by ocean, until in 1977 they produced the object most people have actually seen: the World Ocean Floor panorama, painted from their profiles by an Austrian landscape artist, the whole bottom of the world laid bare with the water taken off.
It is a strange kind of map, because it is not a photograph of anything and it never could be. It is a reconstruction — an enormous act of inference from ships' tracks, most of it drawn by a woman who was not permitted to be on the ships.
In 1999, she wrote about it herself.
Marie Tharp2I worked in the background for most of my career as a scientist, but I have absolutely no resentments. I thought I was lucky to have a job that was so interesting. Establishing the rift valley and the mid-ocean ridge that went all the way around the world for forty thousand miles — that was something important. You could only do that once. You can't find anything bigger than that, at least on this planet.
2 · VerbatimMarie Tharp, "Connect the Dots: Mapping the Seafloor and Discovering the Mid-ocean Ridge" (1999), ch. 2 of Lamont-Doherty Earth Observatory of Columbia: Twelve Perspectives on the First Fifty Years, 1949–1999, ed. Laurence Lippsett; reprinted by WHOI at https://www.whoi.edu/news-insights/content/marie-tharp/
And the map did the thing that a picture does and a table of numbers does not. You cannot look at that map and go on believing the bottom of the sea is a still, dead basement.
So by the end of the 1950s the situation is this.
The sea floor is young everywhere, and thinly dusted, and hot along certain lines. There is a crack forty thousand miles long running round the planet, and it is seismically alive.
Every one of those facts is exactly what Arthur Holmes said you would find if the mantle were convecting and new floor were being made where the current comes up. Nobody yet says so out loud.
And to prove it, they will need one more instrument off the same surplus shelf — a device built to spot the faint dent a steel submarine makes in the Earth's magnetic field.
Next time on The Slow Machine: the tape recorder. A Nobel Prize-winner who built a machine to prove his own grand theory and instead proved himself wrong, then handed the machine to the geologists. Two continents with different North Poles. And the most spectacular rejection letter in the history of the Earth sciences.
Every episode of this series has a page at theslowmachine.com — the full transcript, and a table of every quotation in it with the source it came from. If you would like to write to me, the address is michael.goddard@theslowmachine.com.
Apparatus
Quotations, and where they come from
1Tharp — "When I showed what I found to Bruce, he groaned and said, 'It cannot be. It looks too much like continental drift.'"Verbatim, from Tharp's own later written recollectionMarie Tharp, "Connect the Dots: Mapping the Seafloor and Discovering the Mid-ocean Ridge" (1999), ch. 2 of Lamont-Doherty Earth Observatory of Columbia: Twelve Perspectives on the First Fifty Years, 1949–1999, ed. Laurence Lippsett; widely reprinted
2Tharp — "I worked in the background for most of my career as a scientist, but I have absolutely no resentments… You can't find anything bigger than that, at least on this planet."Verbatim, checked 2026-10-26 against the WHOI reprint, where it is the essay's closing paragraph. Only change: the page's "40,000 miles" is written out as spoken, "forty thousand miles". Added at Michael's request after he read the full essayMarie Tharp, "Connect the Dots: Mapping the Seafloor and Discovering the Mid-ocean Ridge" (1999), ch. 2 of Lamont-Doherty Earth Observatory of Columbia: Twelve Perspectives on the First Fifty Years, 1949–1999, ed. Laurence Lippsett; reprinted by WHOI at https://www.whoi.edu/news-insights/content/marie-tharp/
—"girl talk"Narrator-reported fragment, deliberately not put in a guest voice. Attested only through Tharp's own recollection decades later; Heezen left no record of saying it. The script attributes it as "in her recollection" — keep that hedgeTharp, "Connect the Dots" (1999)
—Heezen, Ewing, Hess — no guest reads—Descriptive only